
How to Make Sales Funnel in Excel
“How to Make Sales Funnel in Excel”. Do you want to boost your sales and increase your revenue? Then a sales funnel is the way to go! But creating one may seem daunting, especially if you’re not familiar with the technicalities. Don’t worry, though – we’ve got you covered. In this post, we’ll teach you how to make a sales funnel in Excel step-by-step. It’s easy, and fun and will help take your business to new heights! So why wait? Let’s dive right in and discover the magic of Excel for creating successful sales funnels!
What is a Sales Funnel?
A sales funnel is a process that helps you track and convert your prospects into paying customers. It’s a key part of your sales strategy, and it’s important to understand how it works so you can optimize your funnel and close more deals.
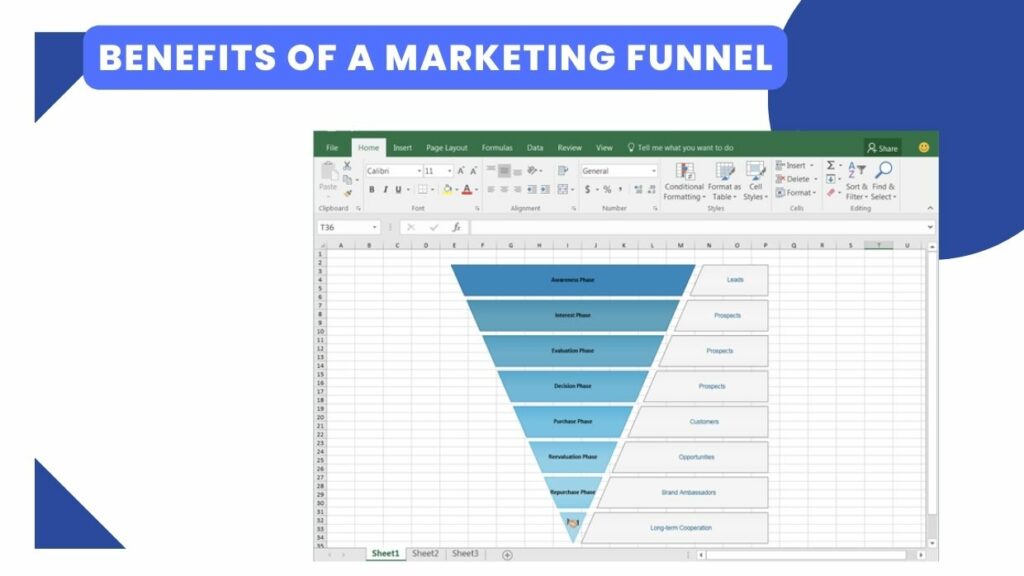
The sales funnel begins with awareness, where you generate interest in your product or service through marketing initiatives like ads, trade shows, or content marketing. If you’ve done a good job of raising awareness, people will move on to the next stage of the funnel: interest.
At this stage, prospects are considering your solution but they’re not yet ready to buy. To move them along, you need to provide more information about your product or service and its value proposition. You can do this through targeted content like case studies, white papers, or e-books.
Once someone is interested in your solution, they’ll move on to the next stage of the funnel: consideration. At this point, they’re evaluating different options and comparing them to see which one is the best fit for their needs. They may reach out to sales reps for more information or request pricing quotes.
Finally, if everything goes well, they’ll reach the last stage of the funnel: purchase. This is when they decide to buy your product or service and become a customer.
It’s important to note that not everyone will make it all the way down the funnel. Some prospects may drop off at any stage, so it’s important to make sure you have an effective lead nurturing strategy in place to keep them engaged and move them closer to a purchase.
How to Set Up a Sales Funnel in Excel
Assuming you have a basic understanding of Excel, setting up a sales funnel is relatively straightforward. The first step is to create a new workbook and name it something like “Sales Funnel.” Then, create two worksheets within that workbook: one for your raw data and one for your sales funnel.
On the raw data worksheet, you’ll want to include columns for each stage of your sales process (e.g. lead, prospect, qualified lead, etc.), as well as columns for the date each stage was reached and the expected close date. You can either manually enter this data or import it from your CRM system.
On the sales funnel worksheet, you’ll want to create a table with columns for each stage of the sales process. Then, using the COUNTIF function, you can populate these columns with the number of leads in each stage of the process. For example, if you have 100 leads in your raw data sheet and 20 are considered prospects, you would put “20” in the Prospects column of your sales funnel sheet.
You can then use conditional formatting to highlight any stages that are lagging behind or illustrate which stages have the most activity. This will give you a quick visual representation of where your sales process might be bottlenecks.
This is just a basic overview of how to set up a sales funnel in Excel – there are many other ways you could do it depending on your specific needs.
A Step-by-Step Guide to Creating a Sales Funnel in Excel
A sales funnel is a marketing tool that helps track and visualize the journey of a customer as they move through the stages of your sales process. By creating a sales funnel in Excel, you can better understand where your customers are getting stuck, identify areas for improvement, and measure your overall success.
Follow these steps to create a sales funnel in Excel:
- Identify the stages of your sales process.
- Create a separate sheet for each stage of the funnel.
- Label each column in the sheet with the relevant information for that stage (e.g., lead source, conversion rate, etc.)
- Use formulas to calculate the number of leads and conversions at each stage of the funnel.
- Visualize your data using charts and graphs.
By following these steps, you can create a sales funnel that will help you track and improve your sales process.
Visualizing Your Data
Excel is a great tool for visualizing data. You can use it to create charts and graphs that show your sales data in an easy-to-understand format. This can help you see where your sales are coming from and where they are going.
To create a sales funnel in Excel, start by creating a new workbook. Then, create two worksheets: one for your raw data and one for your funnel visualization. In the raw data worksheet, input your sales data into columns. Include a column for the date, the customer’s name, the product they purchased, and the price.
In the funnel visualization worksheet, create a stacked bar chart. To do this, select the cells containing your raw data, then go to Insert > Charts > Stacked Bar. Your sales data will be displayed in a bar chart with each sale represented by a different color.
You can use this chart to see which products are selling well and which ones need improvement. You can also use it to track your sales over time and see how your business is doing.
Tips for Improving Your Results
- Keep your sales funnel up-to-date: A sales funnel is only as good as the data you put into it. Make sure to keep your sales funnel spreadsheet updated with the latest leads, deals, and conversions.
- Use filters to segment your data: Segmenting your data allows you to better understand where your leads are coming from and what stage of the funnel they are in. This helps you target your follow-up efforts and improve your results.
- Create custom columns for key data points: Custom columns allow you to track important data points that are specific to your business. This could include things like product interest, budget, or decision maker.
- Use formulas to automate calculations: Formulas can help you automatically calculate things like conversion rate or average deal size. This saves you time and ensures that your numbers are always accurate.
- Visualize your data with charts and graphs: Charts and graphs help you visualize your data and see trends over time. This can be helpful in identifying areas of improvement or opportunity.
- Leverage A/B testing: A/B testing can help you identify which elements are working best in your sales funnel and improve the overall results. Try different variations of content, landing pages, or emails to see what works best.
- Run a lead scoring system: Lead scoring helps you prioritize leads based on their likelihood to convert into customers. You can use the data from your sales funnel to create an accurate lead-scoring system that ensures your time is spent following up with the most qualified leads.
Read more…What are the Benefits of Marketing Funnels?
Conclusion
Building a sales funnel in Excel can be an effective way to track your sales and make sure that your marketing efforts are paying off. With the right layout, you can easily identify which stages of your funnel need improvement and quickly implement changes. We hope that our guide has given you a better understanding of how to make a sales funnel in Excel and help you start improving your conversion rate. Good luck!